Translated by AI from Eero Paloheimo: Maapallon tulevaisuuden arvio. Kanava 6/2026, p. 24-31
Eero Paloheimo
Doctor of Science (Tech.), Professor Emeritus of Wood Construction
Humanity is in a state of uncertainty. In Finland, this is reinforced by disagreements among three groups regarding the future of our planet. The concern of the realists is the all-encompassing destruction threatening our environment.(1) Deniers downplay these threats on shaky grounds. Grim realists have given up because they believe it is too late to fight against destruction. The burden of proof lies on the shoulders of the latter two groups, albeit for different reasons. The purpose of this article is neither to comfort nor to frighten, but to clarify the outlook.
For 40 years, I have presented the metaphor of the falling stick—and later refined analysis—of the impending threat without receiving sensible counter-reactions.(2) My writings have been met with vague references to past “end of the world” scares that proved false. The following analysis further clarifies my previous writings in two ways.
The falling rod (Figure 1) has been given a cross-section (Figure 2) that takes into account James Lovelock’s Gaia theory.(3) According to it, the planet possesses a stabilizing baseline capacity that corrects individual changes, such as continental drift, earthquakes, and ice ages. A normal, stable state keeps the rod upright and renders temporary impulses ineffective. However, the disruption now threatening us is not an impulse, but an intolerably persistent pressure sustained over decades.
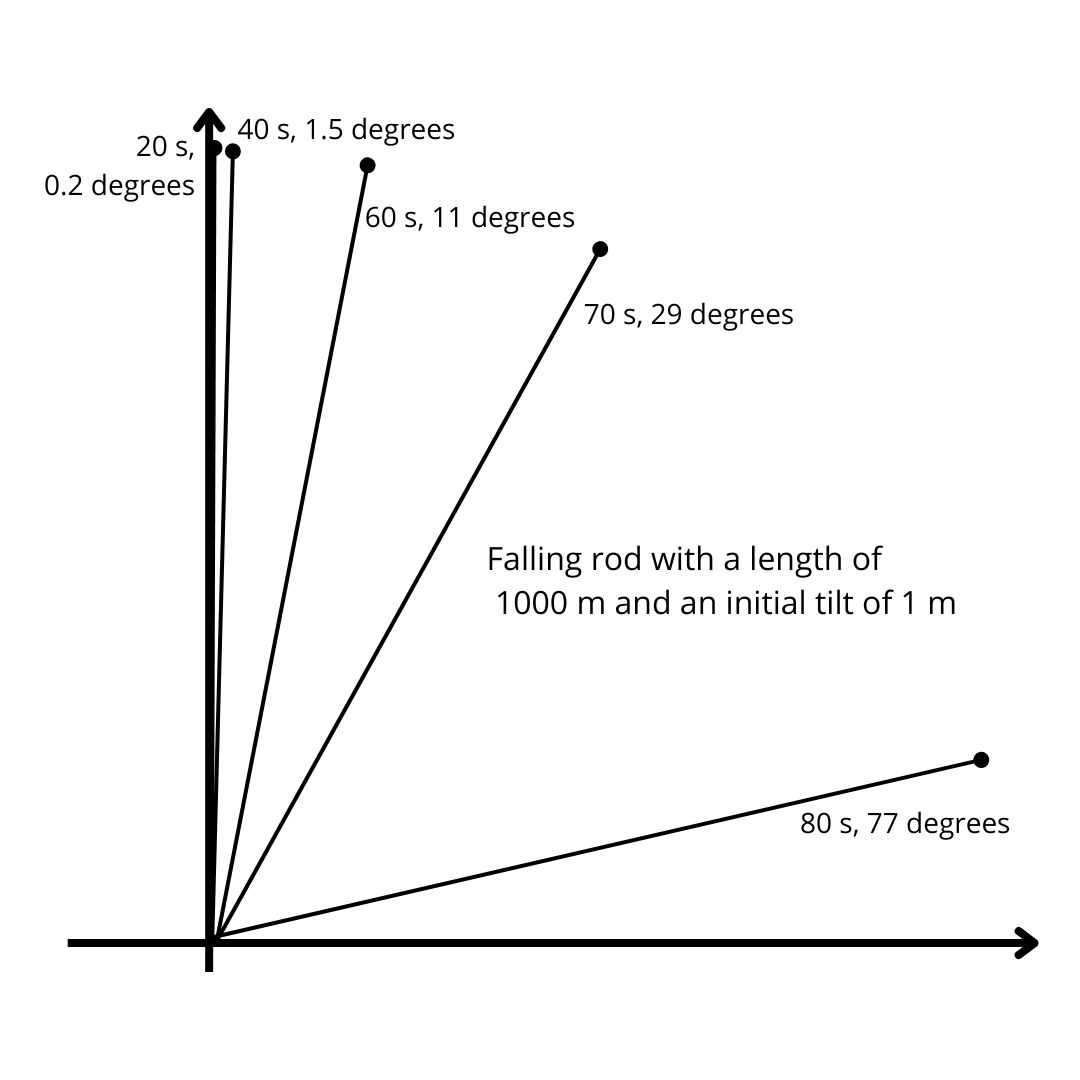 FIGURE 1: The stick or rod was originally conceived as weightless. The weight at its tip moves in a circle as it falls. The fall time is 81 seconds for a kilometer-high stick. The metaphor demonstrates the insidiously deceptive slowness at the beginning and the explosive speed at the end.
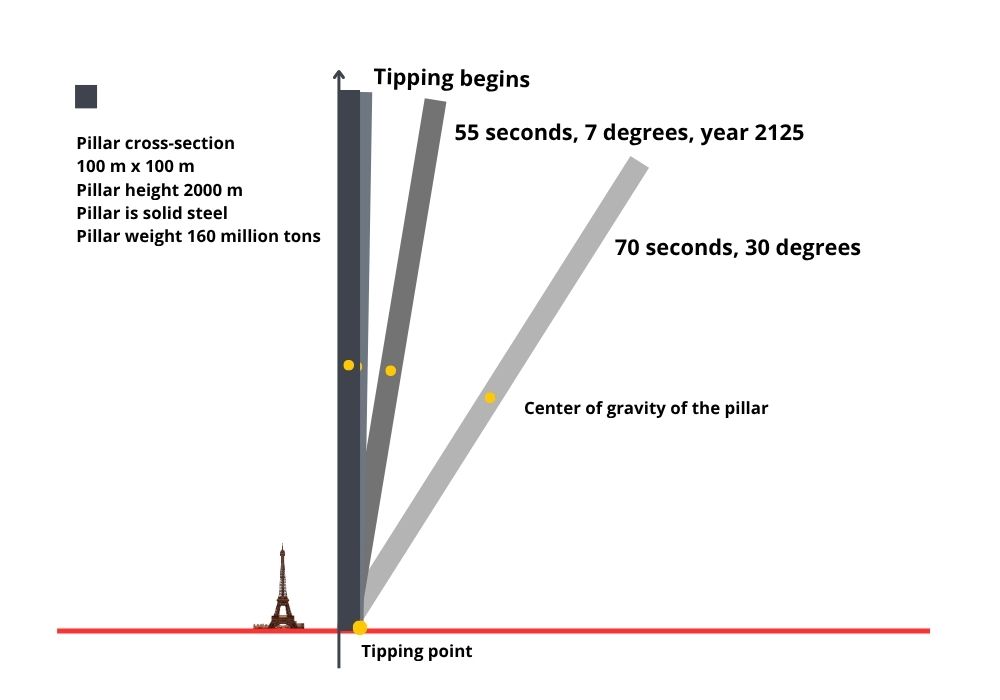 FIGURE 2:
The tipping point is not just any turning point, but the moment when the pillar’s center of gravity passes the support point. The huge pillar behaves like the previous stick after the tipping point, but remains in a stable upright position before tipping, ignoring minor impulses. Its center of gravity is halfway up the pillar. Beyond this point, nature’s stabilizing Lovelock forces no longer work, but turn into factors that cause the pillar to fall. Thus, the pillar falls under its own weight. The pillar can also be replaced by a falling wall. The movement of every rod or wall is mathematically identical after the tipping point.
By 2025, sufficient observational data had been collected, allowing the movement of the falling rod to be compared even more credibly and precisely to the planet’s average temperature deviations from normal.
I am no longer writing about a metaphor, but about observations and the actions they mandate. Instead of an allegory, the basis is now a large-scale model—on the scale of the Eiffel Tower—of the world (Figure 2). The model differs from its real-world counterpart in scale, location, and nature, as do all scale models. The logical structure of its movement corresponds to the world it models, just as a map corresponds to the city it represents.
The cross-section of the pillar is 100 m x 100 m. Its sturdiness allows for a normal stable state. After tipping over, the pillar behaves in the same way as a 10-meter-thick, 1000-meter-wide wall. Neither moves even if the world’s largest airplane crashes into them. The disturbance in that case is an isolated impulse, not a persistent load lasting decades, which is unique and incomparable to past examples.
The tipping of the pillar and the rise in the world’s average temperature follow the same mathematical formula, which in both cases describes the cumulative force inherent in unstable development (Figure 3).
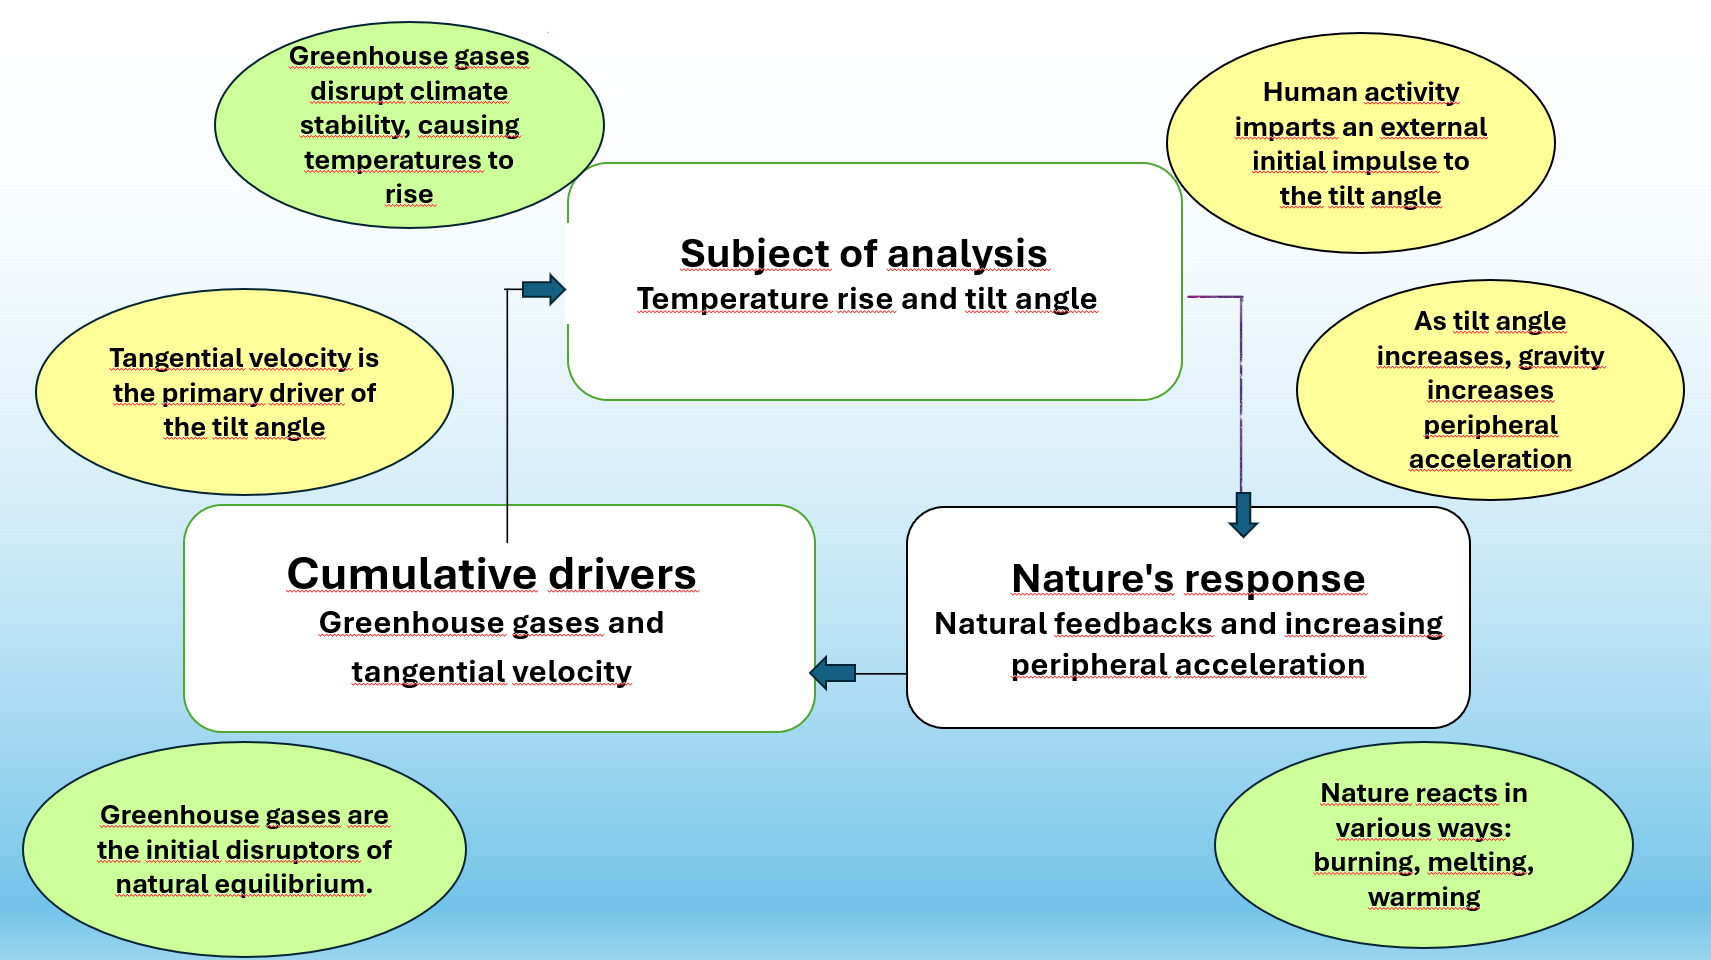
FIGURE 3:
In both comparable processes, an external force is needed to disturb the stable state, after which the mechanism proceeds on its own. To fall, the pillar requires a thrust force that has built up over a longer time, imparting a tangential velocity of 0.1 m/s at the tipping point. The rise in temperature has been caused by decades of greenhouse gases accumulating in the atmosphere. At the tipping or saturation point, the mechanisms give way from their natural stable state, after which natural feedback phenomena accelerate the process automatically.
The tipping of the pillar after the tipping point starts imperceptibly at first, but accelerates rapidly (Figures 1 and 2). Tilt increases and global temperatures rise over time due to strong positive feedback forces. Comparing scales, one decade on Earth corresponds to 2.2 seconds in the rod’s movement time. The initial position corresponds most accurately to the midpoint between 1966 and 1975, or 22 seconds after the tipping point. In comparing basic variables, one degree of rod tilt (ϕ) corresponds to a 3.13 degree deviation from normal average temperature. The tipping point falls around the year 1870.
Sufficient evidence has accumulated on changes in average temperatures
Climate change has been monitored for decades by measuring our planet’s annual average temperatures.(4) Observations have yielded fluctuating results. Although they clearly point to an accelerating temperature change, looking at individual years does not clarify the big picture. On the other hand, decade-by-decade changes in average temperatures have not been parsed in detail due to scarce observational data and the insidious, creeping nature of the process during its first hundred years. Conclusions about future developments could perhaps have been made through bold deduction and logic, but now sufficient observable evidence connecting the model and the real-world precedent has accumulated.
Examining average temperatures over six consecutive decades between 1966 and 2025 yields a set of six averages (Figure 4). Based on these, one can estimate the rate of temperature changes and acceleration across five periods, as well as changes in acceleration across four period pairs.
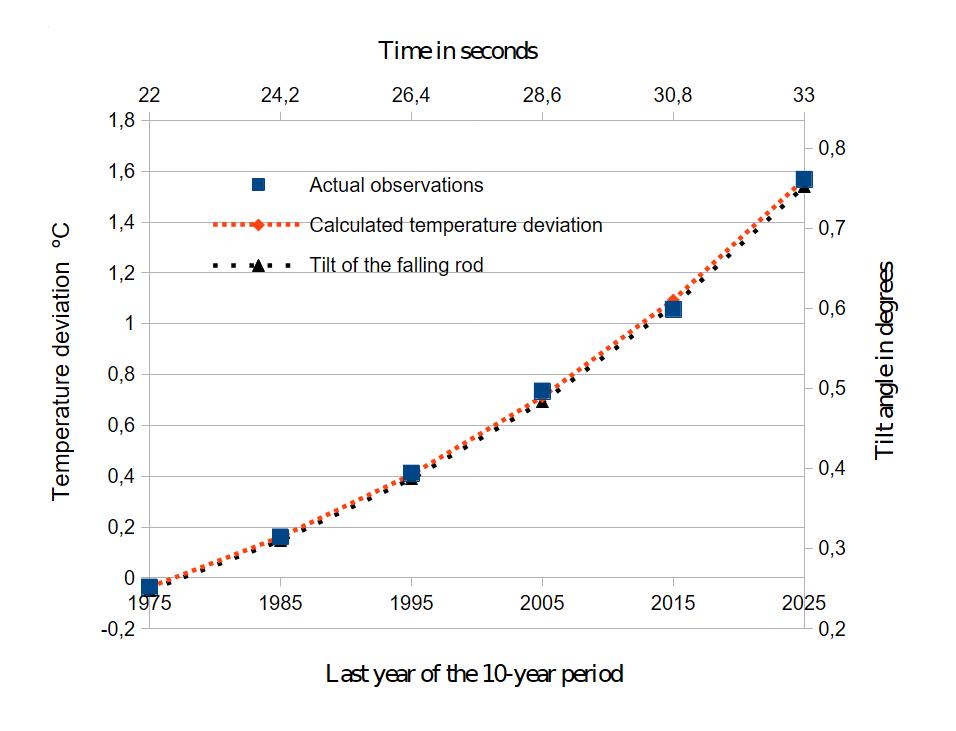 FIGURE 4:
The consistency shown in the figure undeniably supports the comparison of the two processes. Extending this relatively short 50-year period into the past and future is not 100% mathematically grounded, because human actions are political, not mathematical. However, two facts are obvious: 1. The tipping point can be placed around 1870, as the pillar’s movement during the first 22 seconds is negligible. Therefore, human activity was dominant during that century. The decisive rise in temperature occurs only after 1975, and significant rod movement after 22 seconds. It is evident that between 1966 and 2025 (22 to 33 seconds for the rod), natural feedbacks gained momentum and human action became a secondary factor. 2. The next couple of decades are decisive. Unless human countermeasures scale up to an entirely different order of magnitude, the situation will be completely uncontrollable in just 10 years.
TABLE 1
The table contains observational and calculated results helping the reader verify the logic. The rod’s tilt is located and converted to temperature scales using the formula: °Cn=(ϕn- ϕ1) x 3.13 – 0.036
|
Examined |
Temperature |
Temperature |
Values obtained |
Temperature |
Time point |
|
1966–1975 |
−0.036 |
−0.036 |
−0.036 |
−0.036 |
22.0 / 0.254 |
|
1976–1985 |
0.161 |
0.161 |
0.162 |
0.163 |
24.2 / 0.318 |
|
1986–1995 |
0.412 |
0.406 |
0.407 |
0.410 |
26.4 / 0.397 |
|
1996–2005 |
0.735 |
0.712 |
0.713 |
0.716 |
28.6 / 0.494 |
|
2006–2015 |
1.057 |
1.093 |
1.095 |
1.096 |
30.8 / 0.616 |
|
2016–2025 |
1.568 |
1.567 |
1.570 |
1.569 |
33.0 / 0.767 |
Changes in the growth of acceleration are crucial values for forecasting, provided the start and end points of the line representing observations remain unchanged. We can then examine observed and calculated decadal averages from 1966 to 2025 and compare the overall outcome to the precisely known falling process of a rod. This comparison is drawn between polylines and observational points (Figure 4).
Next, let us review which quantities in the two processes are being compared to each other.
Four major natural phenomena lie behind the increase in acceleration
Increasing acceleration is a characteristic feature of an unstable state. In that state, two variables mutually and acceleratively impact each other’s change. Looking at Earth’s current state, one variable is the deviation in average temperature, and the other is the combined effect of at least four massive natural phenomena. This interaction is often called positive—mutually reinforcing— feedback. The whole is what matters, not the individual parts in isolation. Annual human influence is added on top of natural feedbacks.
Wildfires. There appears to be no unified global data on their total number, but there is consensus that their extent spans millions of hectares annually. They drive temperature increases through various consequences, notably the release of carbon dioxide into the atmosphere, destruction of carbon sinks, and soot settling on glaciers. Temperature rises, in turn, increase drought and vulnerability to wildfires.
Melting of glaciers. There is no precise figure for total volume loss, but there is consensus that their disappearance is accelerating annually. Like wildfires, this indirectly increases temperatures in various ways. The primary mechanism is the weakening of solar radiation reflection back to space —the albedo effect—exposing ground beneath ice to melt, along with local ocean current changes (which may partially act as negative feedback). Summed up, melting glaciers warm the climate. An estimated 36% of glaciers have disappeared over the past century.
Outgassing of peatland permafrost. The thawing of peatlands differs from the previous two feedbacks because its impact involves not just carbon dioxide, but also methane release. This raises temperatures more acutely in the short term. Arctic peatlands cease acting as peat producers, and their stored carbon leaks into the atmosphere. Globally, the magnitude of this process is beyond control, but its acceleration is indisputable.
Warming of upper ocean layers. Oceans are a central component of the planet’s carbon cycle. It is perhaps the slowest of the feedback mechanisms in this unstable process, but geographically the most vast and clearly quantifiable. Cool oceans have been central to the carbon cycle as carbon sinks, whereas warm oceans become carbon emitters. Warming in upper ocean layers has also accelerated in recent decades.
A moist greenhouse effect refers to a sequence of events presumed to follow the process described above.(5) It occurs during ocean evaporation, but need not be pondered alongside the aforementioned feedbacks because other active phenomena will bring the planet to a point of no return much faster (if allowed to proceed).
The exact share of individual details of the cumulative effect (Figure 3) relative to total temperature rise is not precisely known. However, this is not necessary, as we know the exact movement of a falling pillar and can estimate the magnitude of that unknown entity based on observational analogy. We also know greenhouse gas volumes with sufficient precision to conclude that human impact was primary to the process up until 1970. However, the exact alignment of curves and polylines (Figure 4) indicates that as the rod’s momentum picked up rapidly after the tipping point, annual human influence on warming became increasingly secondary next to natural feedbacks, and its relative share continues to shrink as the process advances.
At the point corresponding to the rod’s tipping point, human influence was dominant, giving the pillar the initial velocity needed to fall. In the specific case of these observations, the initial tilt velocity at the tipping point is 0.1 m/s, corresponding to an average temperature rise of 0.004 °C per year. This figure fits observations around the year 1900, when human influence had the most significant share in average temperature changes. This also confirms the slow, imperceptible growth shown by the scale model long after crossing the tipping point.
When 22 seconds (100 years) have elapsed from the tipping point, the pillar’s center of gravity has shifted by only 4 meters. After that, the shift jumps by 8 meters in just 50 years. That is the stage we are in now.
Global warming and the falling pillar analogy
The falling rod is not merely an example of an unstable state; as a scale model for global warming, it is surprisingly apt. Its first interacting factor, increasing tilt angle, naturally compares to the average decadal growth of temperature deviation. The second interacting factor, accelerating tilt angle change, compares to the accelerating change in natural phenomena caused by rising warmth. The third variable escalating round after round is cumulative accumulation: the accelerating speed of the rod falling, and in warming, the accelerating buildup of greenhouse gases.
The change can also be described by the equation y = a * e^n + b. Here y is the average temperature rise from normal, e is Euler’s number (2.718), and a, n, and b are parameters matching tilt angle and temperature rise in scale, location, and nature. In this case: a = 0.643, b = -0.837, and n = 0.022 * (x – 1965), where x corresponds to the year under observation (the last year of a ten-year period). But this is just a side note.
Among the interacting factors of the falling rod, tangential velocity corresponds to the summed, feedback-driven combination of large natural phenomena that grows stronger alongside rising temperatures. Setting the rod’s center of gravity at a height of one kilometer and assuming an initial velocity of 0.1 m/s at the tipping point, after 22 seconds its speed is 0.45 m/s, the tilt angle is 0.25 degrees, and the displacement of its center of gravity is only 4.4 meters. Beyond this point, the process proceeds with predictable regularity (Figure 5).
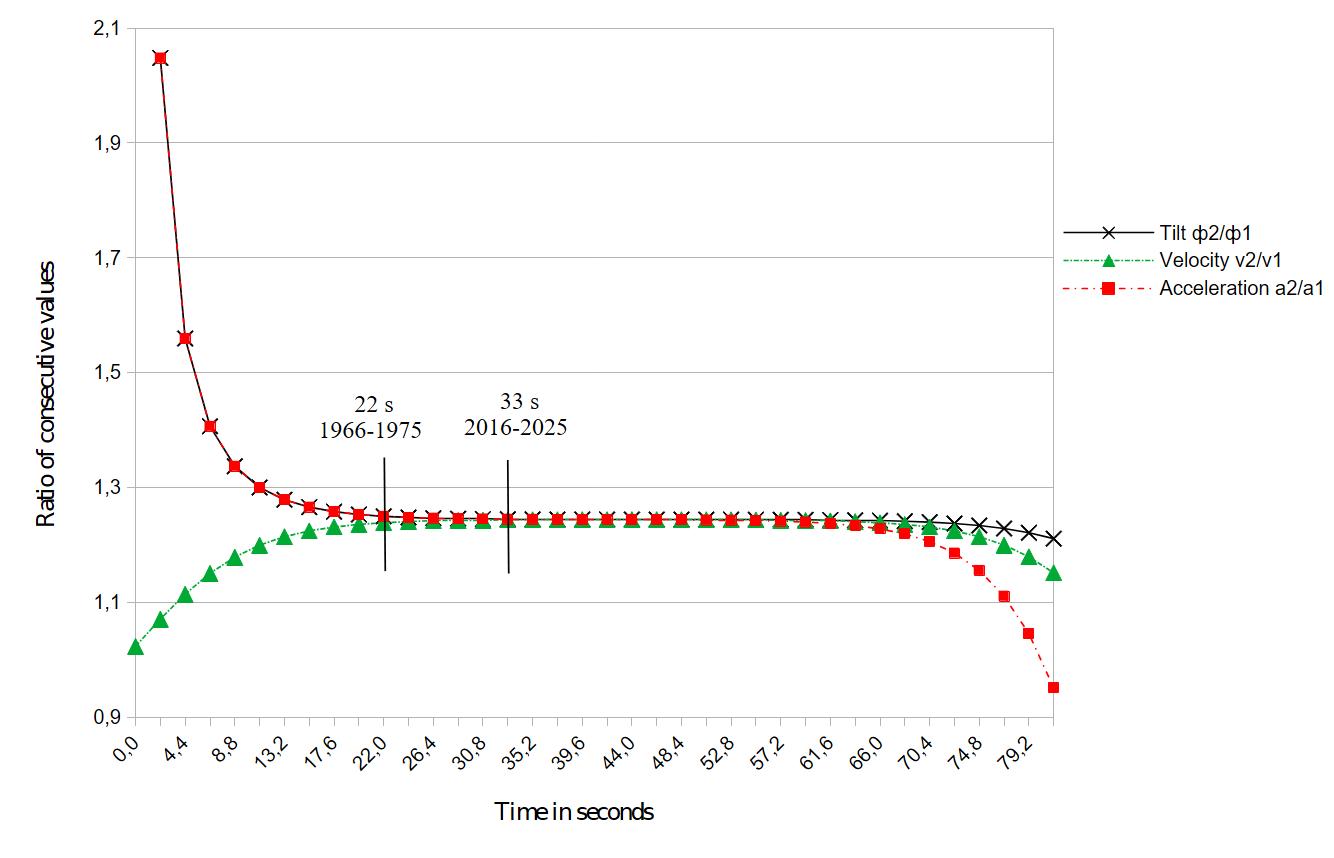
FIGURE 5: Ratios of changes in tilt, tangential velocity, and peripheral acceleration for the falling rod when observed at 2.2 second intervals.
When examining changes in peripheral acceleration, we observe the same pattern after initial velocity as previously seen in decadal average temperature changes. Accelerations grow at a constant ratio as time progresses linearly. The comparison holds at a specific scale and phase of the process. Therefore, analyzing the falling rod can be considered a scale model of a much larger event. The rod moving for 11 seconds at that point corresponds to the temperature rise over a specific 50-year period.
The falling rod model initially yields precise values for various quantities: tilt angle, tangential velocity, and peripheral acceleration. When evaluating the future, however, it is essential to know how tangential velocity and peripheral acceleration change as the rod continues to fall. These changes reveal a constant value in the middle region of the falling process, depending on the time difference between compared changes (Figure 5). A time difference of 2.2 seconds was selected for the presented changes, yielding a constant ratio of 1.246 between consecutive periods. This corresponds remarkably accurately to the averages of actual observations.
When tracking rod tilt at 2.2-second intervals, a polyline can be drawn between 22 and 33 seconds representing acceleration changes every 2.2 seconds. Slopes of line segments increase by a factor of 1.246 period by period. Polylines describing the change in different ways overlap almost perfectly (Figure 4). Acceleration of the rod’s tilt proceeds almost unchanged past 22 seconds until about 60 seconds have passed from the start. Similarly, warming will not stop unless conditions change drastically.
Future evaluation and measures
It is not responsible to claim that significant forces of nature would not obey the laws of physics in coming decades—following observations made over the last sixty years. In the future, acceleration of global average temperatures will likely rise by a factor of approximately 1.246 per decade until no forests or glaciers remain. Deduction yields the following table of temperature rise up to the year 2150 (Table 2).
TABLE 2
Assumed future average temperatures up to 2150 if humanity does not radically and rapidly change the situation. Temperature deviations in the first six rows are averages of observations adjusted according to Column 3 of Table 1. From 2026 onwards, the forecast projects acceleration of constant rises period by period by a factor of 1.246. Development can also be tracked annually with moving averages.
|
Decades of average temperatures selected for observation or deduction |
Observed or estimated average temperature deviation from normal |
|
1966 – 1975 |
-0.04 |
|
1976 – 1985 |
0.16 |
|
1986 – 1995 |
0.41 |
|
1996 – 2005 |
0.71 |
|
2006 – 2015 |
1.09 |
|
2016 – 2025 |
1.57 |
|
2026 – 2035 |
2.16 |
|
2036 – 2045 |
2.90 |
|
2046 – 2055 |
3.82 |
|
2056 – 2065 |
4.96 |
|
2066 – 2075 |
6.39 |
|
2076 – 2085 |
8.16 |
|
2086 – 2095 |
10.4 |
|
2096 – 2105 |
13.1 |
|
2106 – 2115 |
16.6 |
|
2116 – 2125 |
20.9 |
|
2126 -2135 |
26.2 |
|
2136 – 2145 |
32.8 |
|
2146 – 2155 |
41.1 |
Many among us do not care about the state of the world after our death, and people accept beautiful lies more easily than ugly truths. Nevertheless, I have estimated the change up to the year 2150. Hopefully, someone proves me wrong. Over the past forty years, I have heard only vague hopes for a better future, not clear, reasoned analysis. Realistic departures from these hopes have been presented by Finnish journalist Pasi Toiviainen. On the other hand, the most cynical counterargument is: “It’s not the end of the world, the Earth will still orbit the sun.”
Simply stopping the change at its current state would require massive measures, but even that is not enough. The falling state must be restored to stability, preventing it from growing again decade by decade. To ensure sustainability, it is necessary to restore nature’s temperature to pre-1870 (or pre-1970) levels, at which point—according to James Lovelock’s Gaia theory—it will heal its own wounds.
The figures in Table 2 are decadal averages. The next one can only be calculated at the beginning of 2036. We should not wait for that. Therefore, I propose using a “simple moving average,” calculating the average of observations from 2017 to 2026 and comparing that figure to the 2016–2025 average. The result will likely be irregular, but I assume the deviation for 2026 will be approximately 1.63 °C.
If nothing more could be done, people could react with anger toward “harbingers of doom” like me. We would have merely ruined a joyful mood, “riding in a first-class carriage toward the abyss”.(6) But turning the future around is not yet completely impossible, even though it is entirely alien to our current values. Humanity could still declare an all-out, rapid, and unanimous battle to turn our threatening future around. Saving the planet and preserving its rich, diverse life must then override all other goals. This requires at least the following measures, without compromise. And immediately.
1. Wars must end tomorrow, whether it impoverishes the arms industry or not.
2. Armies must unite to save the world, whether it is considered patriotic or not.
3. A planet-saving obligation equivalent to military conscription must be enacted in all countries, whether it hampers economic growth or not.
4. The Sahara and other deserts must be reforested in 20 years, whatever the cost.
5. The atmosphere must be restored to its pre-1900 state, without flinching at the workload.
If these measures succeed, life could continue. With an entirely new emphasis, future generations of humanity and our planet’s rich, diverse life would be chosen as core responsibilities. Like a thorough reformation, all our noble yet decayed idols must be renovated: democracy, welfare, human rights, patriotism, freedom of speech, economic growth, and equality. We can live on our home planet for thousands of years to come once we awaken from the self-deception currently poisoning our present.
Hindsight is the flimsiest form of wisdom. Yet I state that if the burgeoning emergency had been tackled without hesitation 40 years ago, salvation would be much easier now. Global population was only five billion back then. Halving it from that number would have earned immense applause from future generations. We did not commit the same sins as our ancestors, but we are guilty of laziness: delaying good deeds. Humanity’s core values and goals must change soon. Year by year, the situation falls into a more terrible state. Strong change is urgent.
References:
1. Pasi Toiviainen: Ilmastonmuutos. Nyt. (Climate Change. Now.) Otava, 2007
2. Eero Paloheimo: Yhden asian liike kaikkien asialla (Single-issue movement working for everyone’s cause) (Helsingin Sanomat May 17, 1987) and Miksi meillä on kiire? (Why are we in a hurry?) (Aamulehti August 20, 2018)
3. James Lovelock: Gaian kosto (The Revenge of Gaia), Green Spot, Helsinki, 2006
4. NOAA National Centers for Environmental Information, Climate at a Glance: Global Time Series from https://www.ncei.noaa.gov/access/monitoring/climate-at-a-glance/global/time-series
5. Toiviainen, ibid.
6. Georg Henrik von Wright: Ihminen kulttuurin murroksessa (Humanity in the Transition of Culture), Otava, 1996
Kanava 6/2026

